What's coming. What's happening. What it cost.
Most emergency software starts when the phone rings and stops when the water goes down. Velospatial covers the whole event: the risk picture before it, one operating picture during it, and the evidence afterwards.
Three questions, and only one gets asked during the event.
Councils are judged on preparation and recovery as much as on response, and those are the two phases with the least software behind them. The same data serves all three.
The questions a works manager asks in April, not February.
- Which crossings go under, how often, and how deep, from the record rather than from memory
- Roads that close every year, and which of them nothing is watching
- Rainfall history per site, so a forecast means something local
- A trigger level learned per crossing, because a gauge class is set for the catchment and not for your culvert
- Procedures, checklists and contingency plans held by the council instead of one laptop
What it answers
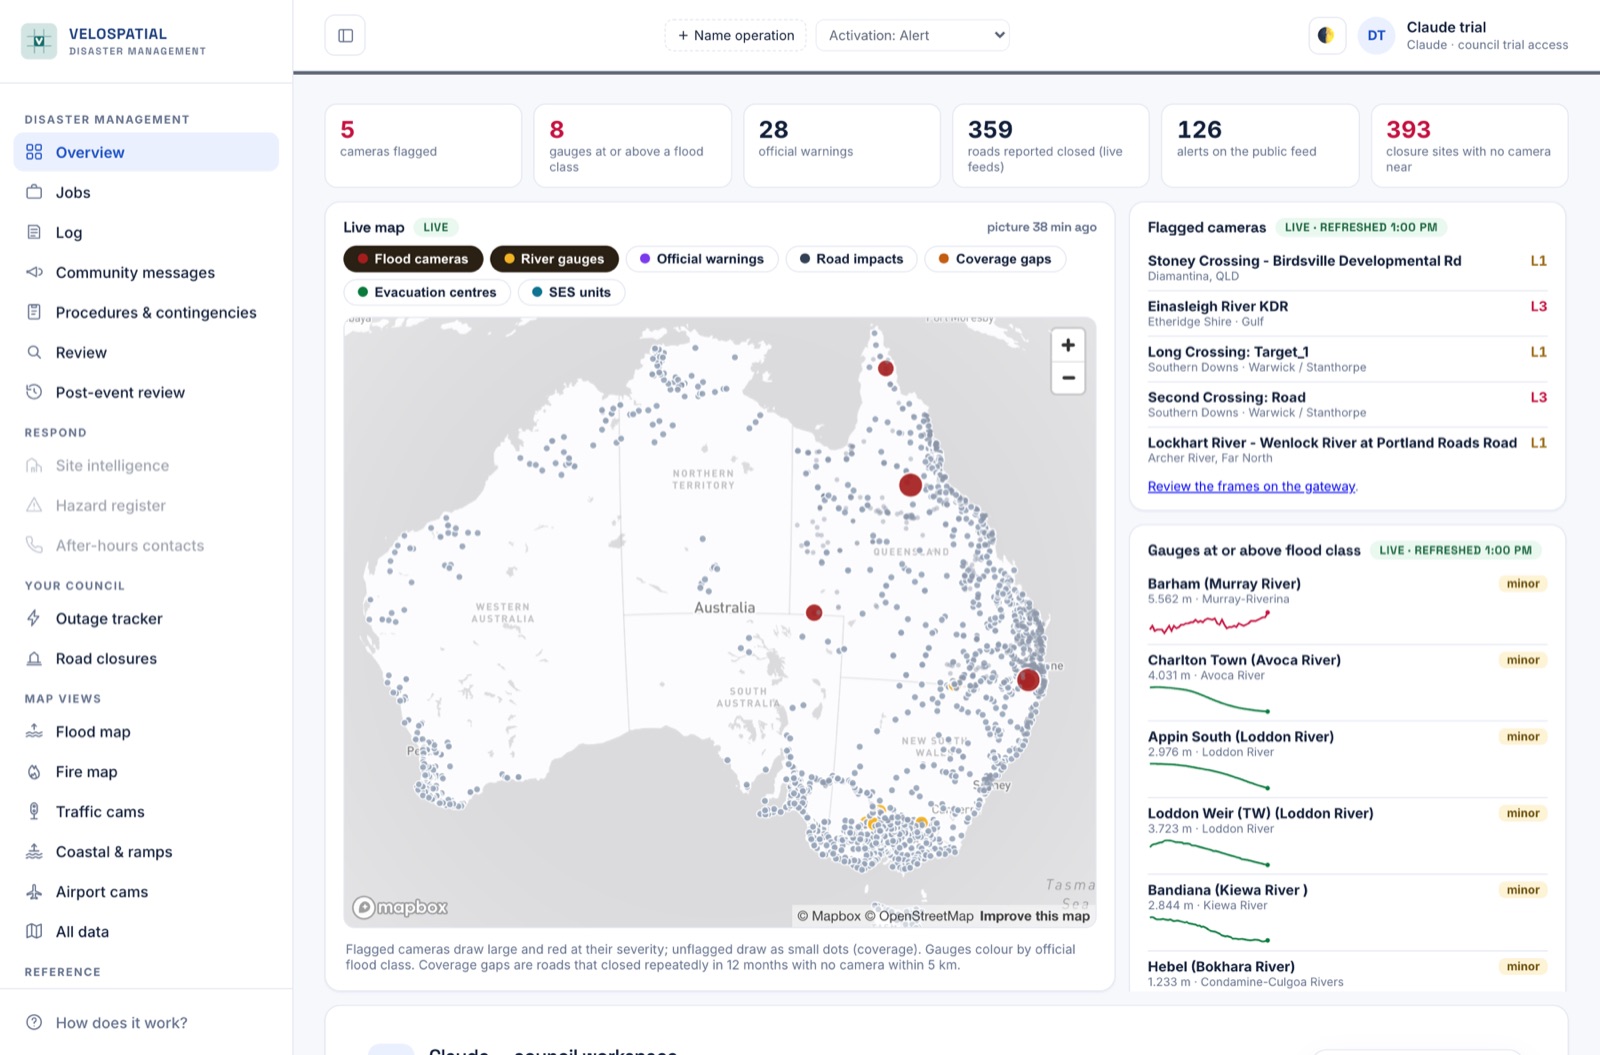
Everything on one screen, in the agency's own words.
- Cameras read every run, with what the water is doing graded against fixed objects in frame
- Warnings from 13 agency feeds across seven jurisdictions, credited and linked back
- Gauges at class, live road closures, power outages, fire hotspots
- Which hospitals, stations and evacuation centres sit close to an active signal
- Activation level, a job list, community messaging, and a situation report you edit and send
What it answers
The questions asked months later, by an auditor or a funding body.
- Events assembled across every camera involved, not one crossing at a time
- First, worst and last frame from each camera kept permanently
- The warnings and closures that were running at the time, held together
- How long each crossing was actually under, separated from how long the event ran
- A record built to be exported, not screenshotted out of a dashboard
What it answers
Flood is where the cameras are. The rest doesn't care which hazard it is.
Coordination, warnings, exposure, closures and the after action record work the same way whatever caused the event. Camera reading is the part built specifically for water on a road, and it would be dishonest to pretend otherwise.
Flood Deep
641 public cameras read and graded on a four level depth scale, around 2,500 river gauges from eight networks with the Bureau's flood classes attached, and a learned trigger level for each individual crossing.
Fire Covered
Warnings and incidents from five fire services, satellite hotspots, and air quality monitoring across every state and territory. Exposure, closures and messaging behave exactly as they do in a flood.
Storm and wind Covered
Agency warnings with the area they actually cover, live rainfall from more than 700 stations, and the road and power consequences as they land.
Power and infrastructure Covered
Live outages from the distributors with premises counts, so an outage is weighed by how many properties it touches rather than treated as a single dot on a map.
Built around what a coordinator is actually asked.
What is flagged and where. What is closed. Which gauges are at class. What the community has been told, and what they can see for themselves. Activation level, procedures and checklists that belong to the council rather than to whichever laptop they were ticked on.
It runs in a browser, needs nothing installed, and falls back to a text only page when the connection is poor, because that is when it matters most. Residents get their own view, so the closure a coordinator confirms is the closure the public sees.
The limits, up front.
- It does not replace SES warnings, Bureau products or a barricade. This is situational awareness, and every screen says so.
- The model proposes, a person disposes. A flagged camera raises a suggestion, never a road closure. Only a council declares an activation, and the platform will not declare one on your behalf.
- Camera reading is for water on a road. It is not a fire detector and we do not claim it is. In fog, heavy rain, glare or darkness it will often say it cannot tell rather than guess.
- Coverage is uneven, and the map shows the gaps. Queensland is dense. Victoria has almost no public flood cameras at all. Where a crossing floods repeatedly with nothing watching it, that is named too.
Same approach, different camera.
Reading a road from a frame is not only useful during an event. Two things are in development, and neither is built yet.
Road condition from vehicles already on the road
Council fleet and contractor vehicles carry cameras already, and they drive the network every week. Reading those frames the way the flood cameras are read turns every trip into a survey: potholes, edge break and faded line marking, each with a date and a position, instead of waiting for a resident to complain.
Pre-disaster condition evidence
Restoration funding turns on proving what condition an asset was in before the event, and councils routinely lose money because they cannot. A dated, continuous record of the road makes that a lookup rather than an argument, and it is the difference between a claim approved and a claim written down.
Bring a road, or an event you had to write up.
Send me the crossings your council worries about, or the last event you had to report on, and I will show you what the platform already holds on it.
A walkthrough takes about twenty minutes and runs against your own area rather than a prepared demo, so you are looking at your roads and your gauges from the start.